Download a copy of the vignette to follow along here: feature_plots.Rmd
Given a cluster solution formatted as a row of a solutions data frame
(or extended solutions data frame) and a data list containing features
to plot, the auto_plot() function can automatically
generate ggplot-based bar and jitter plots showing how that
particular feature was divided across clusters.
library(metasnf)

dl <- data_list(
    list(subc_v, "subcortical_volume", "neuroimaging", "continuous"),
    list(income, "household_income", "demographics", "continuous"),
    list(fav_colour, "favourite_colour", "misc", "categorical"),
    list(pubertal, "pubertal_status", "demographics", "continuous"),
    list(anxiety, "anxiety", "behaviour", "ordinal"),
    list(depress, "depressed", "behaviour", "ordinal"),
    uid = "unique_id"
)
## ℹ 188 observations dropped due to incomplete data.
# Build space of settings to cluster over
set.seed(42)
sc <- snf_config(
    dl = dl,
    n_solutions = 2,
    min_k = 20,
    max_k = 50
)
## ℹ No distance functions specified. Using defaults.## ℹ No clustering functions specified. Using defaults.
# Clustering
sol_df <- batch_snf(dl, sc)

sol_df_row <- sol_df[1, ]
The row you pick could come from a solutions_df or
ext_solutions_df class object.
plot_list <- auto_plot(
    sol_df_row = sol_df_row,
    dl = dl,
    verbose = TRUE
)
## Generating plot 1/35: smri_vol_scs_cbwmatterlh
## Generating plot 2/35: smri_vol_scs_ltventriclelh
## Generating plot 3/35: smri_vol_scs_inflatventlh
## Generating plot 4/35: smri_vol_scs_crbwmatterlh
## Generating plot 5/35: smri_vol_scs_crbcortexlh
## Generating plot 6/35: smri_vol_scs_tplh
## Generating plot 7/35: smri_vol_scs_caudatelh
## Generating plot 8/35: smri_vol_scs_putamenlh
## Generating plot 9/35: smri_vol_scs_pallidumlh
## Generating plot 10/35: smri_vol_scs_3rdventricle
## Generating plot 11/35: smri_vol_scs_4thventricle
## Generating plot 12/35: smri_vol_scs_bstem
## Generating plot 13/35: smri_vol_scs_hpuslh
## Generating plot 14/35: smri_vol_scs_amygdalalh
## Generating plot 15/35: smri_vol_scs_csf
## Generating plot 16/35: smri_vol_scs_aal
## Generating plot 17/35: smri_vol_scs_vedclh
## Generating plot 18/35: smri_vol_scs_cbwmatterrh
## Generating plot 19/35: smri_vol_scs_ltventriclerh
## Generating plot 20/35: smri_vol_scs_inflatventrh
## Generating plot 21/35: smri_vol_scs_crbwmatterrh
## Generating plot 22/35: smri_vol_scs_crbcortexrh
## Generating plot 23/35: smri_vol_scs_tprh
## Generating plot 24/35: smri_vol_scs_caudaterh
## Generating plot 25/35: smri_vol_scs_putamenrh
## Generating plot 26/35: smri_vol_scs_pallidumrh
## Generating plot 27/35: smri_vol_scs_hpusrh
## Generating plot 28/35: smri_vol_scs_amygdalarh
## Generating plot 29/35: smri_vol_scs_aar
## Generating plot 30/35: smri_vol_scs_vedcrh
## Generating plot 31/35: household_income
## Generating plot 32/35: colour
## Generating plot 33/35: pubertal_status
## Generating plot 34/35: cbcl_anxiety_r
## Generating plot 35/35: cbcl_depress_r
plot_list$"household_income"
plot_list$"smri_vol_scs_csf"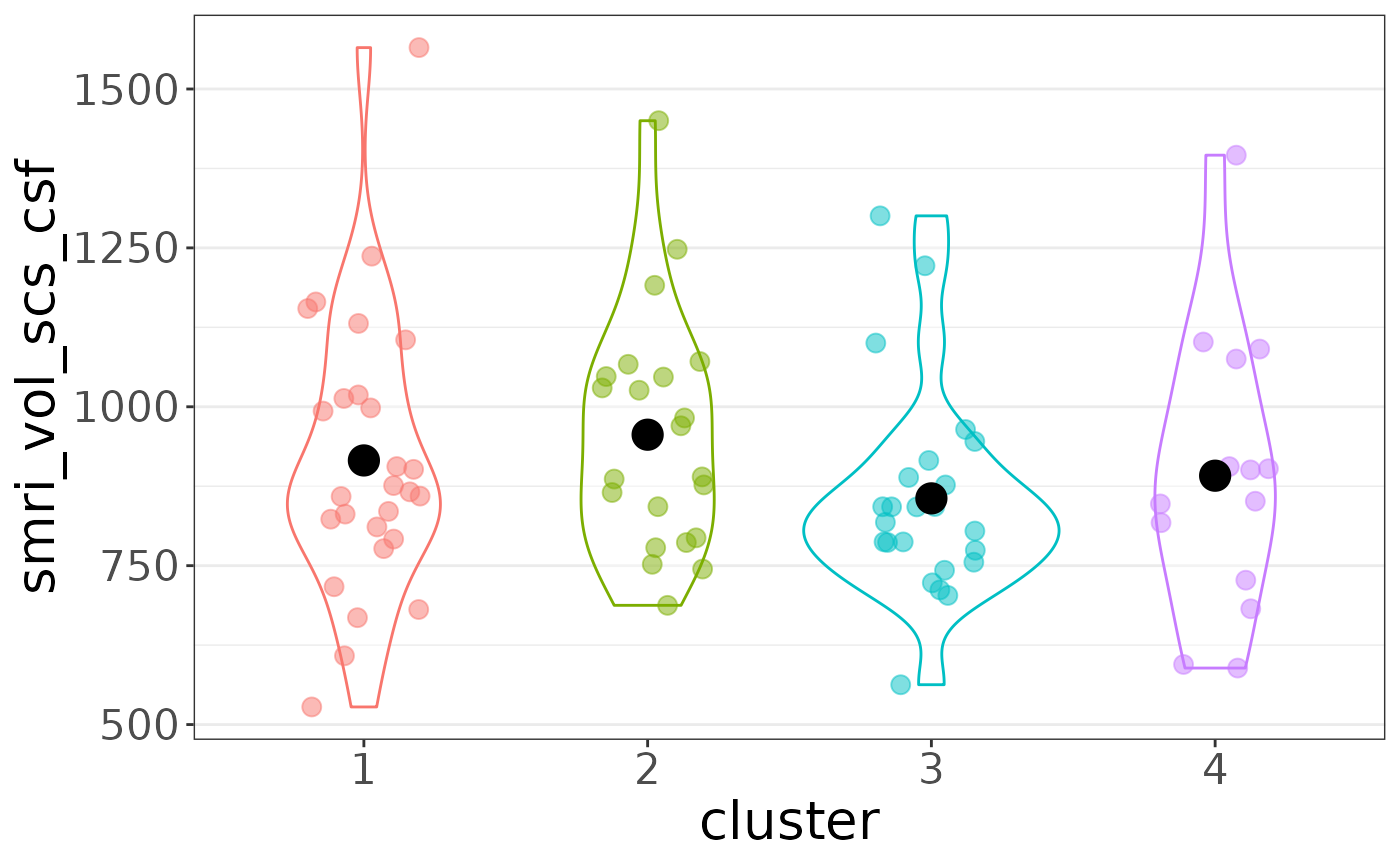
plot_list$"colour"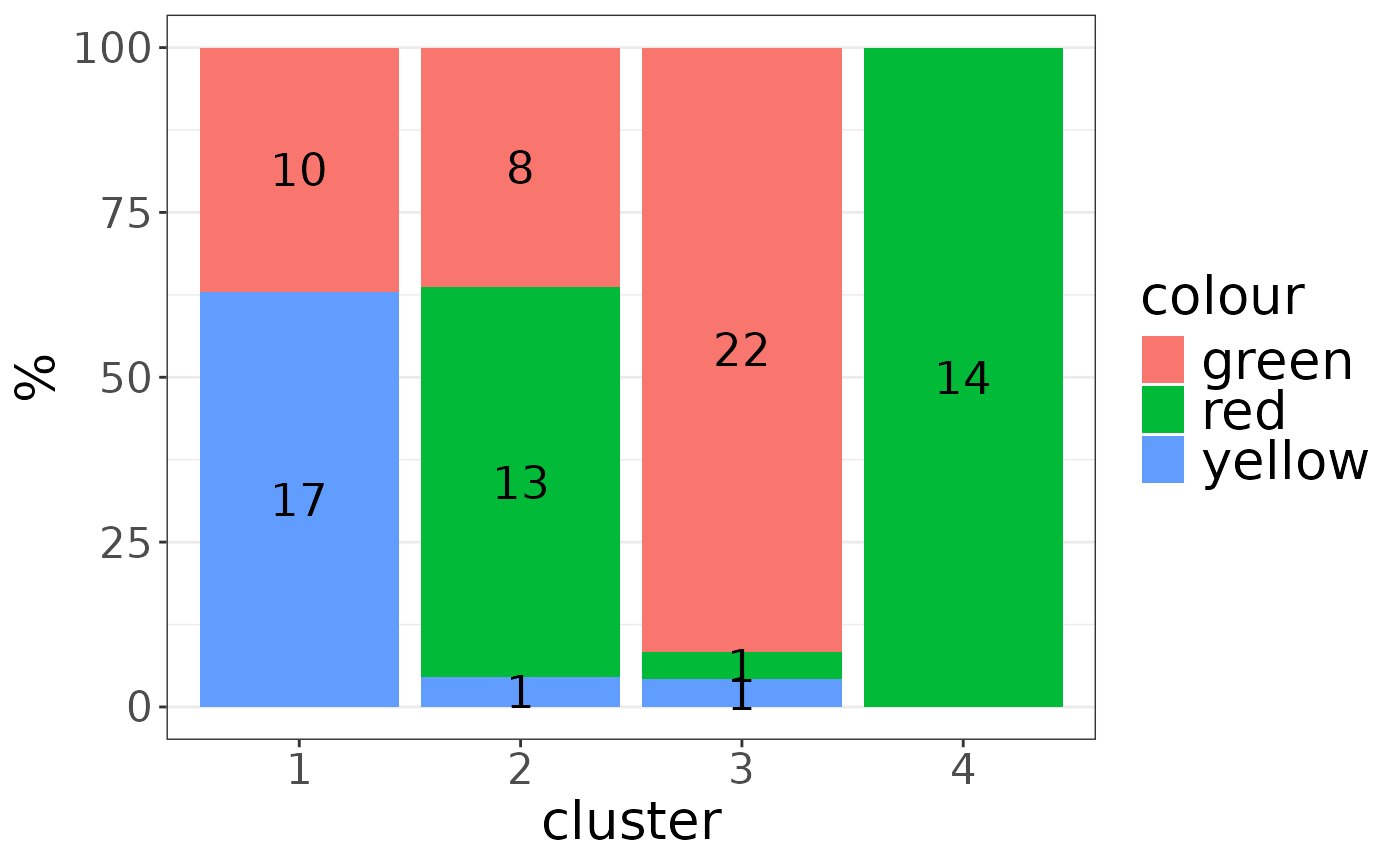
If there’s something you’d like to change about the plot, you can
always tack on ggplot2 elements to build from the skeleton
provided by auto_plot:
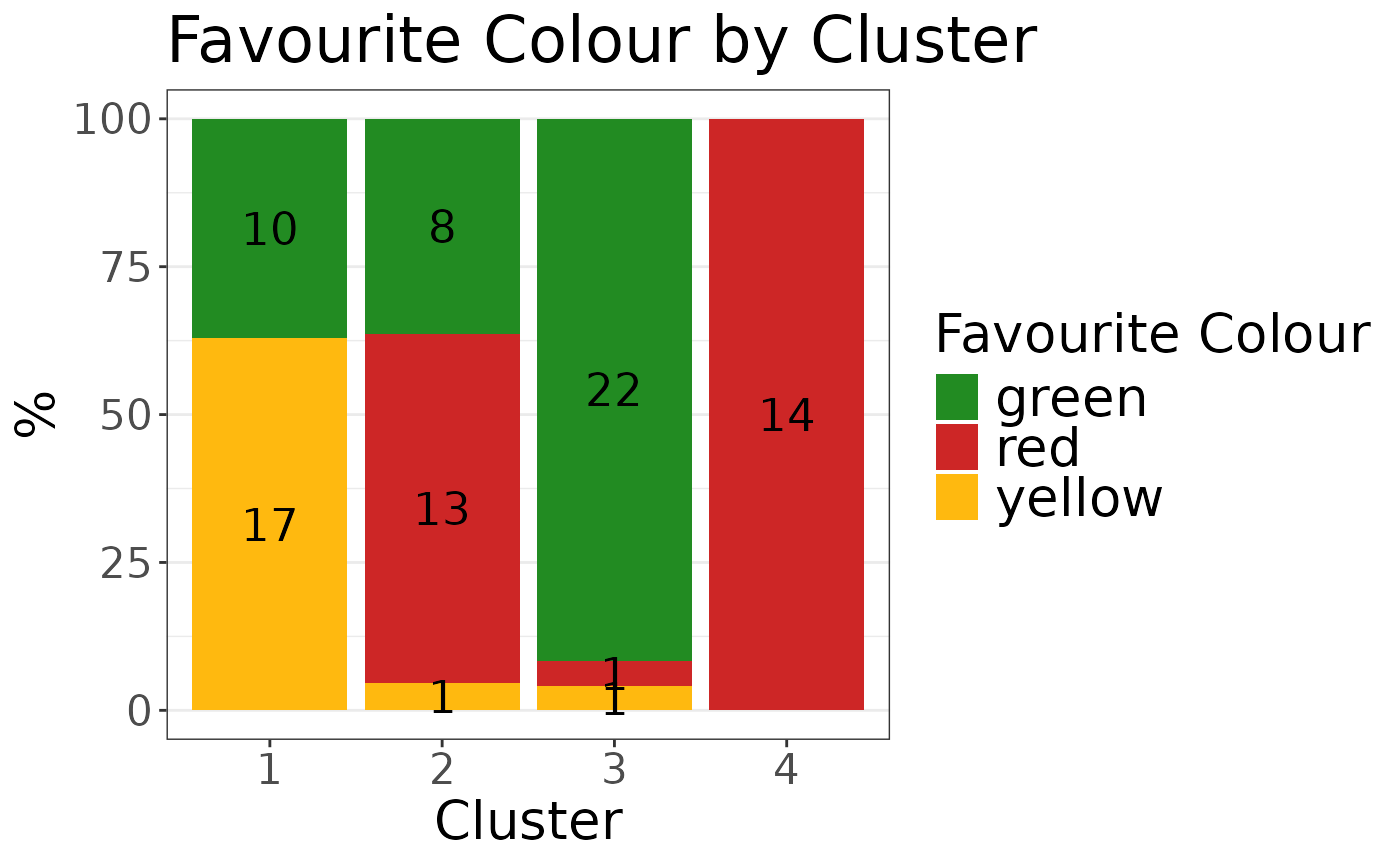
plot_list$"colour" +
    ggplot2::labs(
        fill = "Favourite Colour",
        x = "Cluster",
        title = "Favourite Colour by Cluster"
    ) +
    ggplot2::scale_fill_manual(
        values = c(
            "green" = "forestgreen",
            "red" = "firebrick3",
            "yellow" = "darkgoldenrod1"
        )
    )