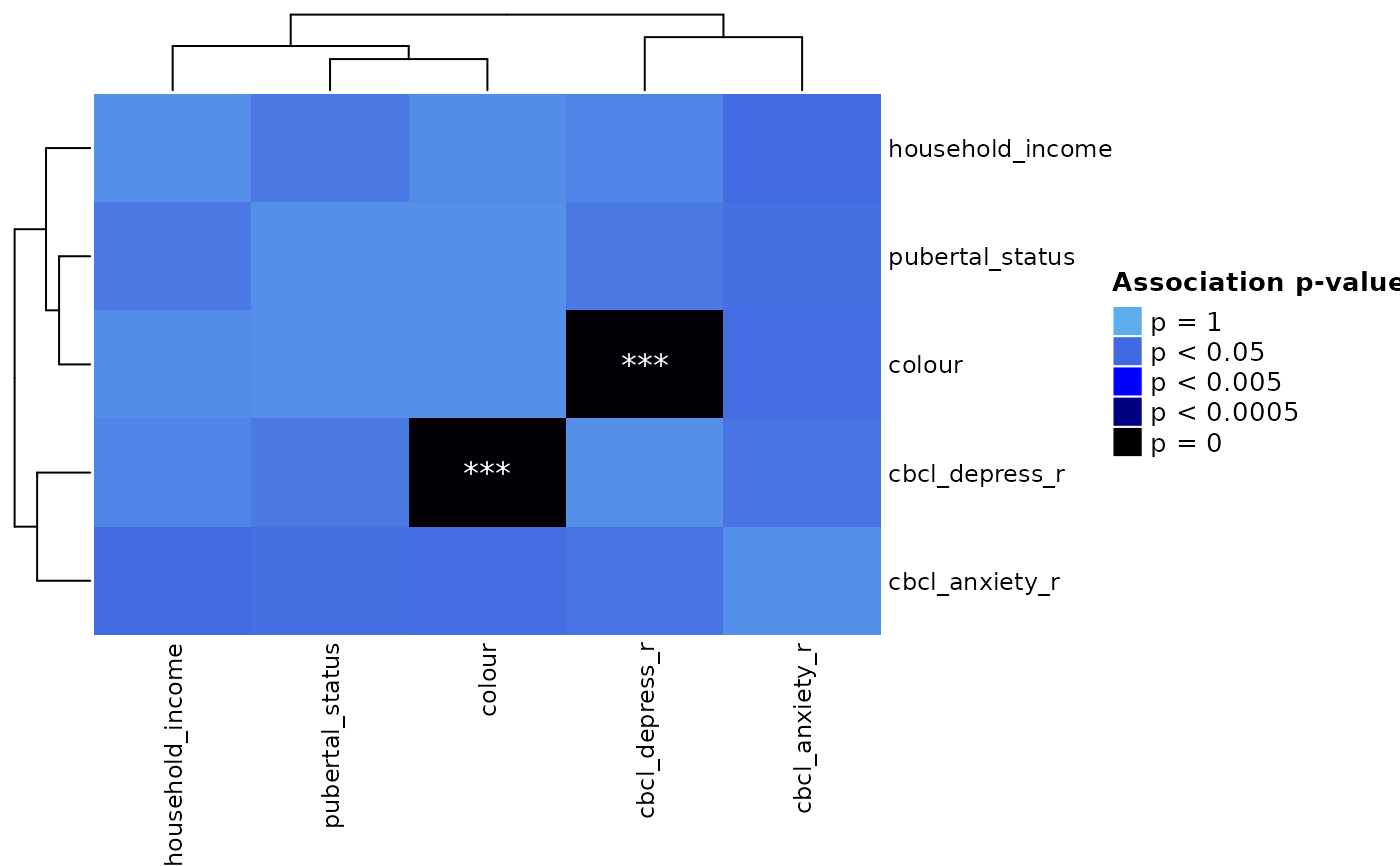
Heatmap of pairwise associations between features
Usage
assoc_pval_heatmap(
  correlation_matrix,
  scale_diag = "max",
  cluster_rows = TRUE,
  cluster_columns = TRUE,
  show_row_names = TRUE,
  show_column_names = TRUE,
  show_heatmap_legend = FALSE,
  confounders = NULL,
  out_of_models = NULL,
  annotation_colours = NULL,
  labels_colour = NULL,
  split_by_domain = FALSE,
  dl = NULL,
  significance_stars = TRUE,
  slice_font_size = 8,
  ...
)
Arguments
- correlation_matrix
Matrix containing all pairwise association p-values. The recommended way to obtain this matrix is through the calc_assoc_pval function.
- scale_diag
Parameter that controls how the diagonals of the correlation_matrix are adjusted in the heatmap. For best viewing, this is set to "max", which will match the diagonals to whichever pairwise association has the highest p-value.
- cluster_rows
Parameter for ComplexHeatmap::Heatmap. Will be ignored if split_by_domain is also provided.
- cluster_columns
Parameter for ComplexHeatmap::Heatmap. Will be ignored if split_by_domain is also provided.
- show_row_names
Parameter for ComplexHeatmap::Heatmap.
- show_column_names
Parameter for ComplexHeatmap::Heatmap.
- show_heatmap_legend
Parameter for ComplexHeatmap::Heatmap.
- confounders
A named list where the elements are columns in the correlation_matrix and the names are the corresponding display names.
- out_of_models
Like confounders, but a named list of out of model measures (who are also present as columns in the correlation_matrix).
- annotation_colours
Named list of heatmap annotations and their colours.
- labels_colour
Vector of colours to use for the columns and rows of the heatmap.
- split_by_domain
Visually slice the heatmap based on feature domains.
- dl
A nested list of input data from
data_list().- significance_stars
If TRUE (default), plots significance stars on heatmap cells
- slice_font_size
Font size for domain separating labels.
- ...
Additional parameters passed into ComplexHeatmap::Heatmap.
Value
Returns a heatmap (class "Heatmap" from package ComplexHeatmap) that displays the pairwise associations between features from the provided correlation_matrix.
Examples
# \donttest{
data_list <- data_list(
    list(income, "household_income", "demographics", "ordinal"),
    list(pubertal, "pubertal_status", "demographics", "continuous"),
    list(fav_colour, "favourite_colour", "demographics", "categorical"),
    list(anxiety, "anxiety", "behaviour", "ordinal"),
    list(depress, "depressed", "behaviour", "ordinal"),
    uid = "unique_id"
)
#> ℹ 139 observations dropped due to incomplete data.

assoc_pval_matrix <- calc_assoc_pval_matrix(data_list)
ap_heatmap <- assoc_pval_heatmap(assoc_pval_matrix)

# }
# }