Density plot of co-clustering stability across subsampled data
Source:R/coclustering.R
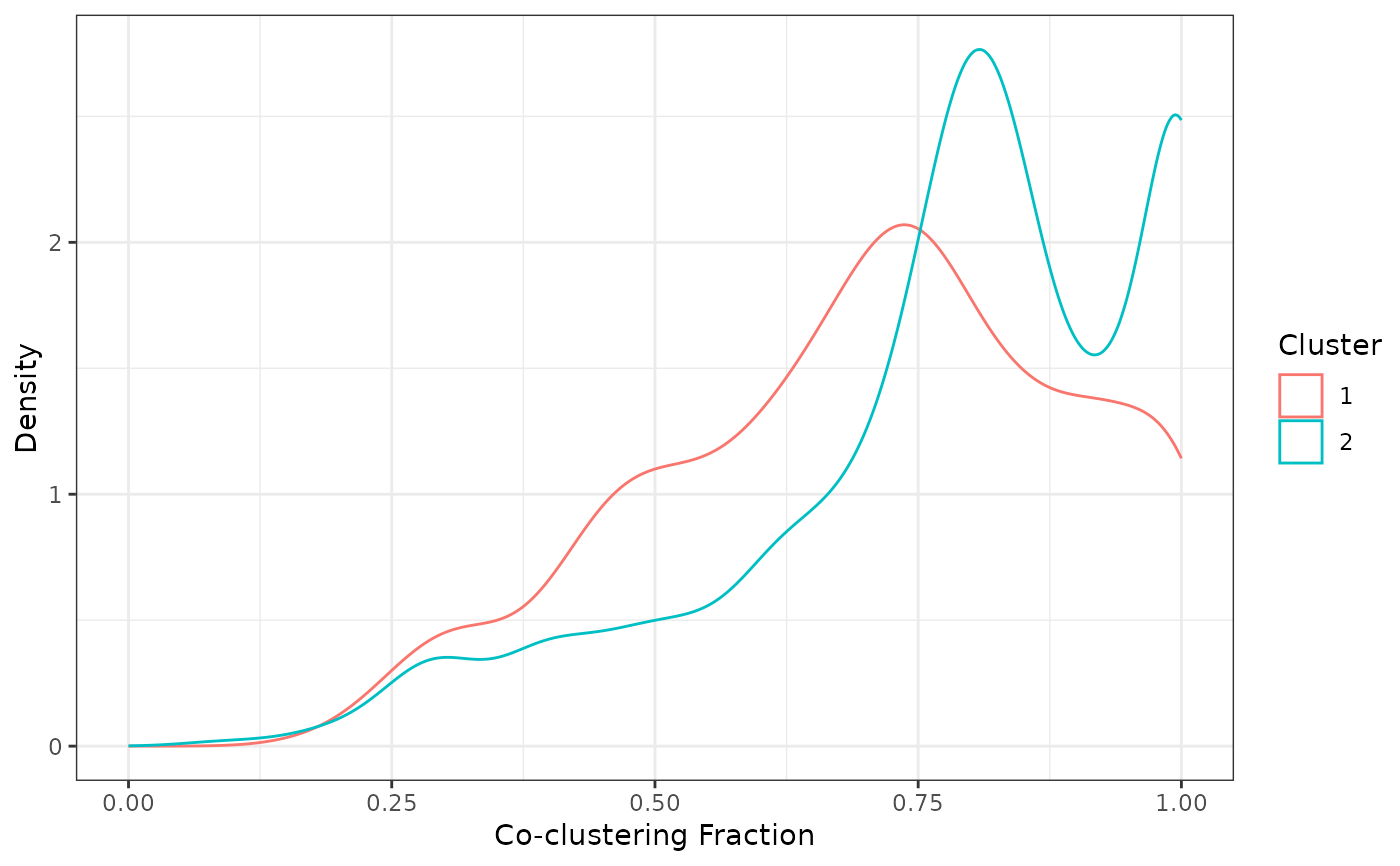
cocluster_density.RdThis function creates a density plot that shows, for all pairs of observations that originally clustered together, the distribution of the the fractions that those pairs clustered together across subsampled data.
Value
Density plot (class "gg", "ggplot") of the distribution of co-clustering across pairs and subsamples of the data.
Examples
# \donttest{
my_dl <- data_list(
    list(subc_v, "subcortical_volume", "neuroimaging", "continuous"),
    list(income, "household_income", "demographics", "continuous"),
    list(pubertal, "pubertal_status", "demographics", "continuous"),
    uid = "unique_id"
)
#> ℹ 175 observations dropped due to incomplete data.

sc <- snf_config(my_dl, n_solutions = 5, max_k = 40)
#> ℹ No distance functions specified. Using defaults.
#> ℹ No clustering functions specified. Using defaults.

sol_df <- batch_snf(my_dl, sc)

my_dl_subsamples <- subsample_dl(
    my_dl,
    n_subsamples = 20,
    subsample_fraction = 0.85
)

batch_subsample_results <- batch_snf_subsamples(
    my_dl_subsamples,
    sc
)

coclustering_results <- calculate_coclustering(
    batch_subsample_results,
    sol_df,
    verbose = TRUE
)
#> Processing solution 1/5
#> Processing solution 2/5
#> Processing solution 3/5
#> Processing solution 4/5
#> Processing solution 5/5

cocluster_dfs <- coclustering_results$"cocluster_dfs"

cocluster_density(cocluster_dfs[[1]])

# }
# }