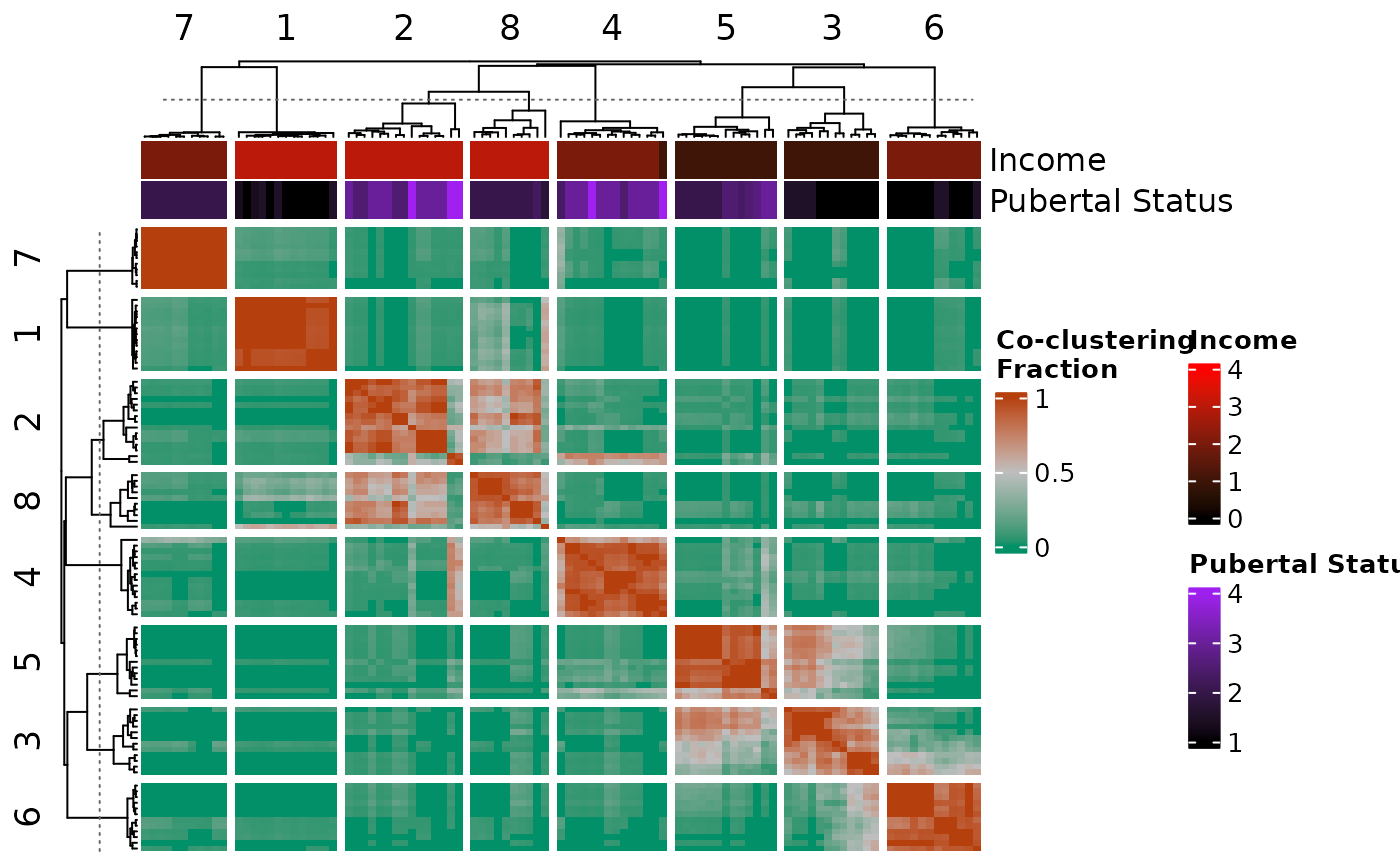
Heatmap of observation co-clustering across resampled data
Source:R/coclustering.R
cocluster_heatmap.RdCreate a heatmap that shows the distribution of observation co-clustering across resampled data.
Usage
cocluster_heatmap(
  cocluster_df,
  cluster_rows = TRUE,
  cluster_columns = TRUE,
  show_row_names = FALSE,
  show_column_names = FALSE,
  dl = NULL,
  data = NULL,
  left_bar = NULL,
  right_bar = NULL,
  top_bar = NULL,
  bottom_bar = NULL,
  left_hm = NULL,
  right_hm = NULL,
  top_hm = NULL,
  bottom_hm = NULL,
  annotation_colours = NULL,
  min_colour = NULL,
  max_colour = NULL,
  ...
)
Arguments
- cocluster_df
A data frame containing co-clustering data for a single cluster solution. This object is generated by the
calculate_coclusteringfunction.- cluster_rows
Argument passed to
ComplexHeatmap::Heatmap().- cluster_columns
Argument passed to
ComplexHeatmap::Heatmap().- show_row_names
Argument passed to
ComplexHeatmap::Heatmap().- show_column_names
Argument passed to
ComplexHeatmap::Heatmap().- dl
See ?similarity_matrix_heatmap.
- data
See ?similarity_matrix_heatmap.
- left_bar
See ?similarity_matrix_heatmap.
- right_bar
See ?similarity_matrix_heatmap.
- top_bar
See ?similarity_matrix_heatmap.
- bottom_bar
See ?similarity_matrix_heatmap.
- left_hm
See ?similarity_matrix_heatmap.
- right_hm
See ?similarity_matrix_heatmap.
- top_hm
See ?similarity_matrix_heatmap.
- bottom_hm
See ?similarity_matrix_heatmap.
- annotation_colours
See ?similarity_matrix_heatmap.
- min_colour
See ?similarity_matrix_heatmap.
- max_colour
See ?similarity_matrix_heatmap.
- ...
Arguments passed to
ComplexHeatmap::Heatmap().
Value
Heatmap (class "Heatmap" from ComplexHeatmap) object showing the distribution of observation co-clustering across resampled data.
Examples
# \donttest{
    my_dl <- data_list(
        list(subc_v, "subcortical_volume", "neuroimaging", "continuous"),
        list(income, "household_income", "demographics", "continuous"),
        list(pubertal, "pubertal_status", "demographics", "continuous"),
        uid = "unique_id"
    )
#> ℹ 175 observations dropped due to incomplete data.

    sc <- snf_config(my_dl, n_solutions = 5, max_k = 40)
#> ℹ No distance functions specified. Using defaults.
#> ℹ No clustering functions specified. Using defaults.

    sol_df <- batch_snf(my_dl, sc)

    my_dl_subsamples <- subsample_dl(
        my_dl,
        n_subsamples = 20,
        subsample_fraction = 0.85
    )

    batch_subsample_results <- batch_snf_subsamples(
        my_dl_subsamples,
        sc
    )

    coclustering_results <- calculate_coclustering(
        batch_subsample_results,
        sol_df,
        verbose = TRUE
    )
#> Processing solution 1/5
#> Processing solution 2/5
#> Processing solution 3/5
#> Processing solution 4/5
#> Processing solution 5/5

    cocluster_dfs <- coclustering_results$"cocluster_dfs"

    cocluster_heatmap(
        cocluster_dfs[[1]],
        dl = my_dl,
        top_hm = list(
            "Income" = "household_income",
            "Pubertal Status" = "pubertal_status"
        ),
        annotation_colours = list(
            "Pubertal Status" = colour_scale(
                c(1, 4),
                min_colour = "black",
                max_colour = "purple"
            ),
            "Income" = colour_scale(
                c(0, 4),
                min_colour = "black",
                max_colour = "red"
            )
        )
    )

# }
# }