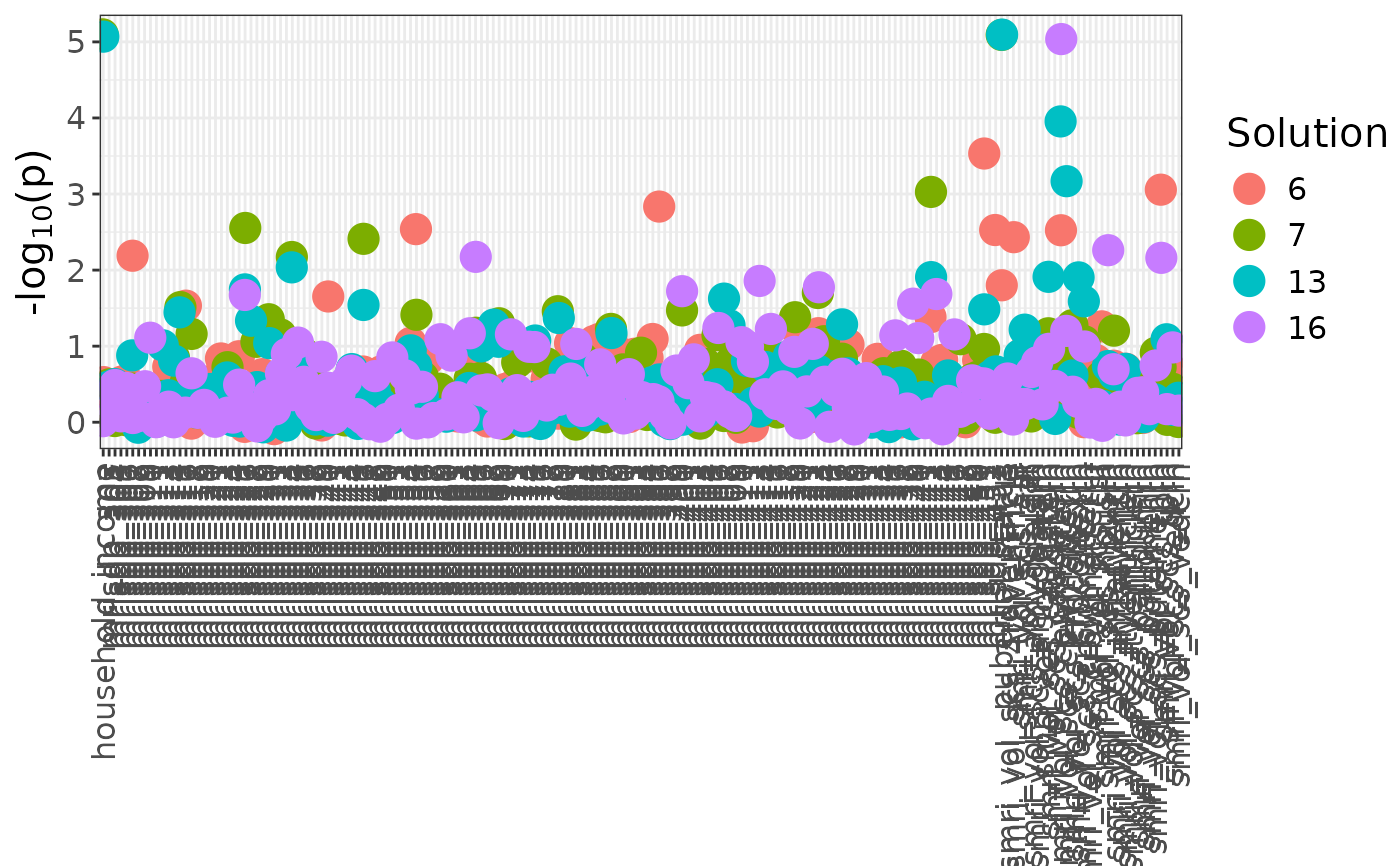
Manhattan plot of feature-cluster association p-values
Source:R/manhattan_plot.R
esm_manhattan_plot.RdManhattan plot of feature-cluster association p-values
Usage
esm_manhattan_plot(
  esm,
  neg_log_pval_thresh = 5,
  threshold = NULL,
  point_size = 5,
  jitter_width = 0.1,
  jitter_height = 0.1,
  text_size = 15,
  plot_title = NULL,
  hide_x_labels = FALSE,
  bonferroni_line = FALSE
)
Arguments
- esm
Extended solutions data frame storing associations between features and cluster assignments. See
?extend_solutions.- neg_log_pval_thresh
Threshold for negative log p-values.
- threshold
P-value threshold to plot dashed line at.
- point_size
Size of points in the plot.
- jitter_width
Width of jitter.
- jitter_height
Height of jitter.
- text_size
Size of text in the plot.
- plot_title
Title of the plot.
- hide_x_labels
If TRUE, hides x-axis labels.
- bonferroni_line
If TRUE, plots a dashed black line at the Bonferroni-corrected equivalent of the p-value threshold.