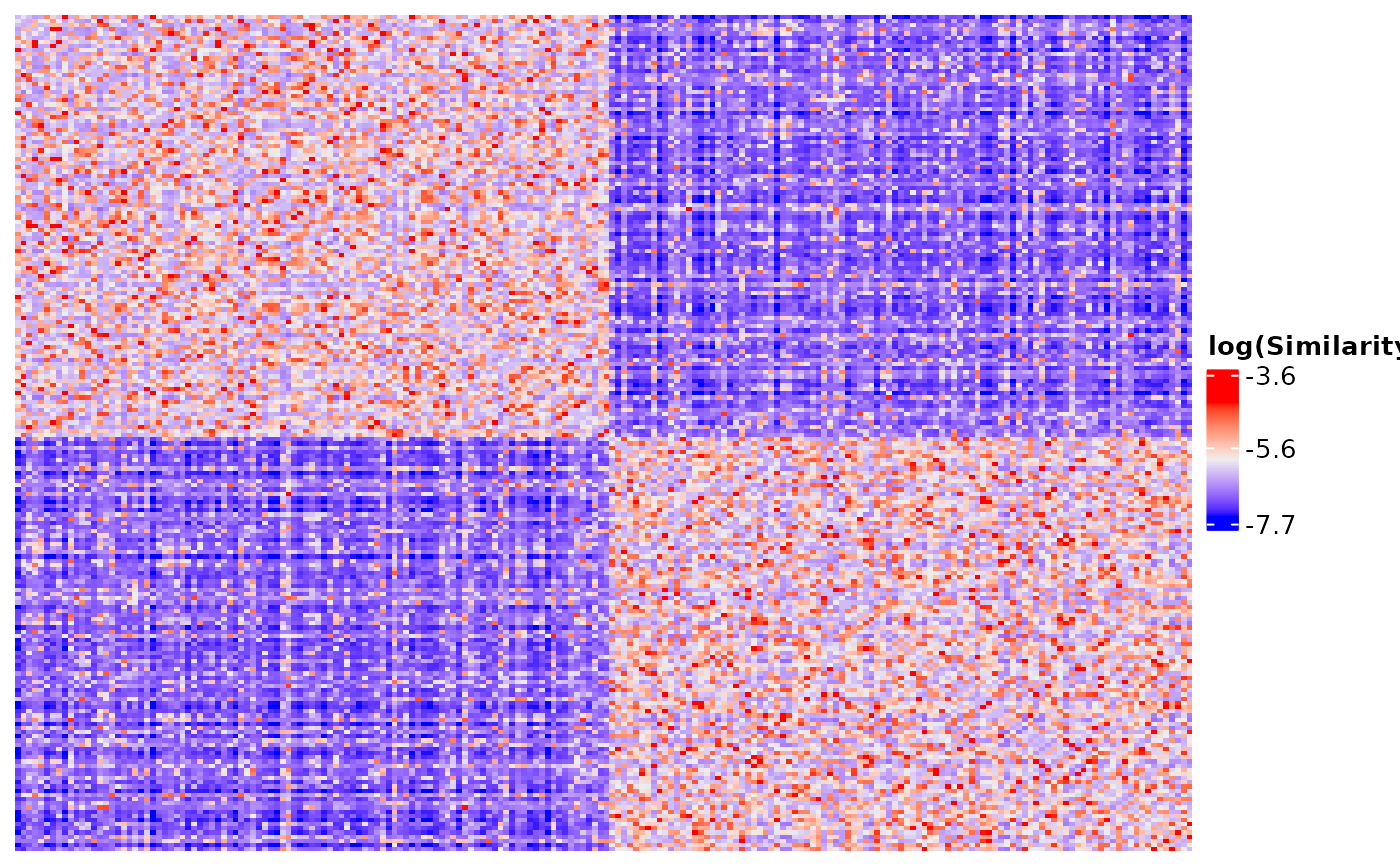
Plot heatmap of similarity matrix
Usage
similarity_matrix_heatmap(
  similarity_matrix,
  order = NULL,
  cluster_solution = NULL,
  scale_diag = "mean",
  log_graph = TRUE,
  cluster_rows = FALSE,
  cluster_columns = FALSE,
  show_row_names = FALSE,
  show_column_names = FALSE,
  data = NULL,
  left_bar = NULL,
  right_bar = NULL,
  top_bar = NULL,
  bottom_bar = NULL,
  left_hm = NULL,
  right_hm = NULL,
  top_hm = NULL,
  bottom_hm = NULL,
  annotation_colours = NULL,
  min_colour = NULL,
  max_colour = NULL,
  split_vector = NULL,
  row_split = NULL,
  column_split = NULL,
  ...
)
Arguments
- similarity_matrix
A similarity matrix
- order
Vector of numbers to reorder the similarity matrix (and data if provided). Overwrites ordering specified by cluster_solution param.
- cluster_solution
Row of a solutions data frame or column of a transposed solutions data frame.
- scale_diag
Method of rescaling matrix diagonals. Can be "none" (don't change diagonals), "mean" (replace diagonals with average value of off-diagonals), or "zero" (replace diagonals with 0).
- log_graph
If TRUE, log transforms the graph.
- cluster_rows
Parameter for ComplexHeatmap::Heatmap.
- cluster_columns
Parameter for ComplexHeatmap::Heatmap.
- show_row_names
Parameter for ComplexHeatmap::Heatmap.
- show_column_names
Parameter for ComplexHeatmap::Heatmap.
- data
A data frame containing elements requested for annotation.
- left_bar
Named list of strings, where the strings are features in df that should be used for a barplot annotation on the left of the plot and the names are the names that will be used to caption the plots and their legends.
- right_bar
See left_bar.
- top_bar
See left_bar.
- bottom_bar
See left_bar.
- left_hm
Like left_bar, but with a heatmap annotation instead of a barplot annotation.
- right_hm
See left_hm.
- top_hm
See left_hm.
- bottom_hm
See left_hm.
- annotation_colours
Named list of heatmap annotations and their colours.
- min_colour
Colour used for the lowest value in the heatmap.
- max_colour
Colour used for the highest value in the heatmap.
- split_vector
A vector of partition indices.
- row_split
Standard parameter of
ComplexHeatmap::Heatmap.- column_split
Standard parameter of
ComplexHeatmap::Heatmap.- ...
Additional parameters passed into ComplexHeatmap::Heatmap.
Value
Returns a heatmap (class "Heatmap" from package ComplexHeatmap) that displays the similarities between observations in the provided matrix.
Examples
# \donttest{
my_dl <- data_list(
    list(
        data = expression_df,
        name = "expression_data",
        domain = "gene_expression",
        type = "continuous"
    ),
    list(
        data = methylation_df,
        name = "methylation_data",
        domain = "gene_methylation",
        type = "continuous"
    ),
    uid = "patient_id"
)

sc <- snf_config(my_dl, n_solutions = 10)
#> ℹ No distance functions specified. Using defaults.
#> ℹ No clustering functions specified. Using defaults.

sol_df <- batch_snf(my_dl, sc, return_sim_mats = TRUE)

sim_mats <- sim_mats_list(sol_df)

similarity_matrix_heatmap(
    sim_mats[[1]],
    cluster_solution = sol_df[1, ]
)
#> Sorting by cluster solution.

# }
# }