Calculate pairwise adjusted Rand indices across subsamples of data
Source:R/coclustering.R
subsample_pairwise_aris.RdGiven a list of subsampled solutions data frames from
'batch_snf_subsamples(), this function calculates the adjusted Rand
indices across all the subsamples of each solution. ARI calculation between
two subsamples only factors in observations that were present in both
subsamples.
Arguments
- subsample_solutions
A list of solutions data frames from subsamples of the data. This object is generated by the function
batch_snf_subsamples().- verbose
If TRUE, output progress to console.
Value
A two-item list: "raw_aris", a list of inter-subsample pairwise ARI matrices (one for each full cluster solution) and "ari_summary", a data frame containing the mean and SD of the inter-subsample ARIs for each original cluster solution.
Examples
# \donttest{
my_dl <- data_list(
list(subc_v, "subcortical_volume", "neuroimaging", "continuous"),
list(income, "household_income", "demographics", "continuous"),
list(pubertal, "pubertal_status", "demographics", "continuous"),
uid = "unique_id"
)
#> ℹ 175 observations dropped due to incomplete data.
sc <- snf_config(my_dl, n_solutions = 5, max_k = 40)
#> ℹ No distance functions specified. Using defaults.
#> ℹ No clustering functions specified. Using defaults.
my_dl_subsamples <- subsample_dl(
my_dl,
n_subsamples = 20,
subsample_fraction = 0.85
)
batch_subsample_results <- batch_snf_subsamples(
my_dl_subsamples,
sc
)
pairwise_aris <- subsample_pairwise_aris(
batch_subsample_results,
verbose = TRUE
)
#> Calculating pairwise ARIs for solution 1/5...
#> Calculating pairwise ARIs for solution 2/5...
#> Calculating pairwise ARIs for solution 3/5...
#> Calculating pairwise ARIs for solution 4/5...
#> Calculating pairwise ARIs for solution 5/5...
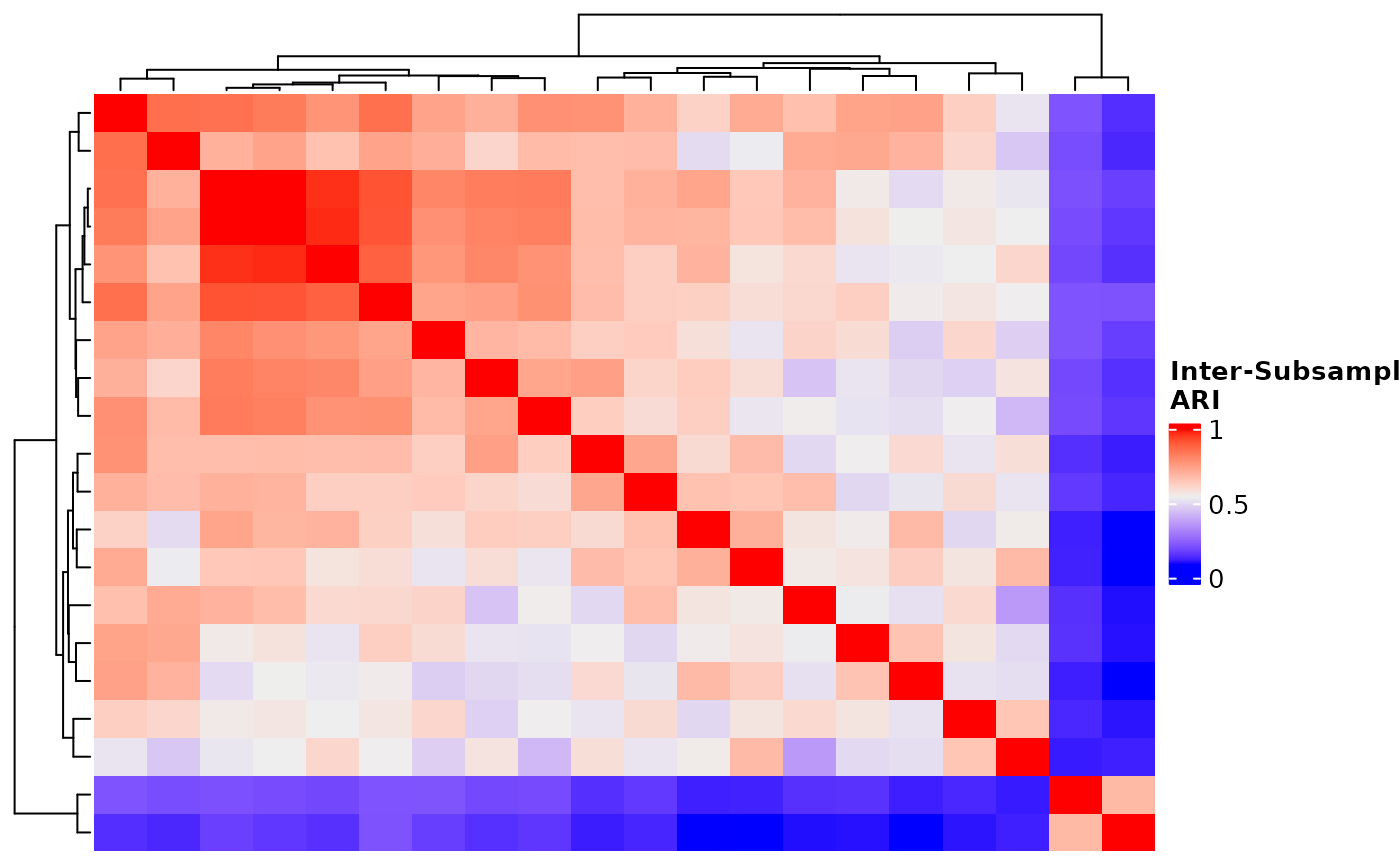
# Visualize ARIs
ComplexHeatmap::Heatmap(
pairwise_aris$"raw_aris"[[1]],
heatmap_legend_param = list(
color_bar = "continuous",
title = "Inter-Subsample\nARI",
at = c(0, 0.5, 1)
),
show_column_names = FALSE,
show_row_names = FALSE
)
 # }
# }